How CodeDD Measures Scalability: The Operational Index and the Architecture Tier
A repository-driven model for quantifying how far a platform can grow before it breaks — co-developed with input from EY.
Why measuring scalability is hard
Every CTO and investor has encountered the same question: "Can this platform handle 10x the load without a rewrite?" It sounds simple, but the honest answer requires evidence from inside the codebase, not just a pitch deck.
Traditional scalability assessments fall into two camps, and both are incomplete on their own:
- Runtime benchmarks measure what happens under load today. They are expensive, slow, and tell you nothing about why the system will struggle at 10x — only that it will.
- Narrative architecture reviews describe patterns ("we use microservices") without ground-truth evidence that those patterns are actually implemented throughout the codebase.
CodeDD takes a third approach: a repository-driven, evidence-based scoring model that reads the code, the configuration, the dependencies, and the component graph, and produces two complementary scores:
- The Architecture Tier — a 1-to-5 classification of what kind of system this is structurally (monolith, modular monolith, SOA, microservices, or real-time distributed system).
- The Operational Index — a 0-to-100 score of how efficiently that system is implemented within its tier.
Together they answer two very different questions, and both matter.
The Formula 1 analogy
The two scores are easiest to grasp through a racing analogy.
-
Architecture Tier = the racing class. Is this a Formula 3 car, a Formula 2, or a Formula 1? A Formula 3 car is not a bad car — it is built for a specific championship. But it will never win a Formula 1 Grand Prix no matter how well it is tuned, because the class itself has a ceiling on performance, downforce, engine power, and tire technology.
-
Operational Index = how well the car is engineered within its class. Two Formula 1 teams — Ferrari and Williams, say — can have identical theoretical tier (both F1), but vastly different race performance because of gearbox efficiency, tire management, aerodynamic refinement, and pit-stop execution. One team may be at 92 out of 100 within its class, the other at 55.
This maps cleanly to software:
- A well-engineered modular monolith (Tier 2, Operational Index 85) will outperform a sloppily-built microservice system (Tier 4, Operational Index 30) at low-to-moderate scale, and will be cheaper to operate.
- But when traffic truly explodes — a successful product launch, a viral moment, a large enterprise contract — the Tier 2 system hits its class ceiling. No amount of tuning the monolith will make it handle Tier 5 workloads. You need to change the car.
The Architecture Tier tells you whether the platform can, in principle, reach the scale you need. The Operational Index tells you how much headroom you have inside the current class — and whether you are extracting the value that class can deliver.
The 5-tier architecture model
The tier model was developed in collaboration with EY and draws on their reference taxonomy of enterprise-scale architectures. The original slide below summarises the five tiers, their characteristics, typical data stores, infrastructure, and representative platforms.
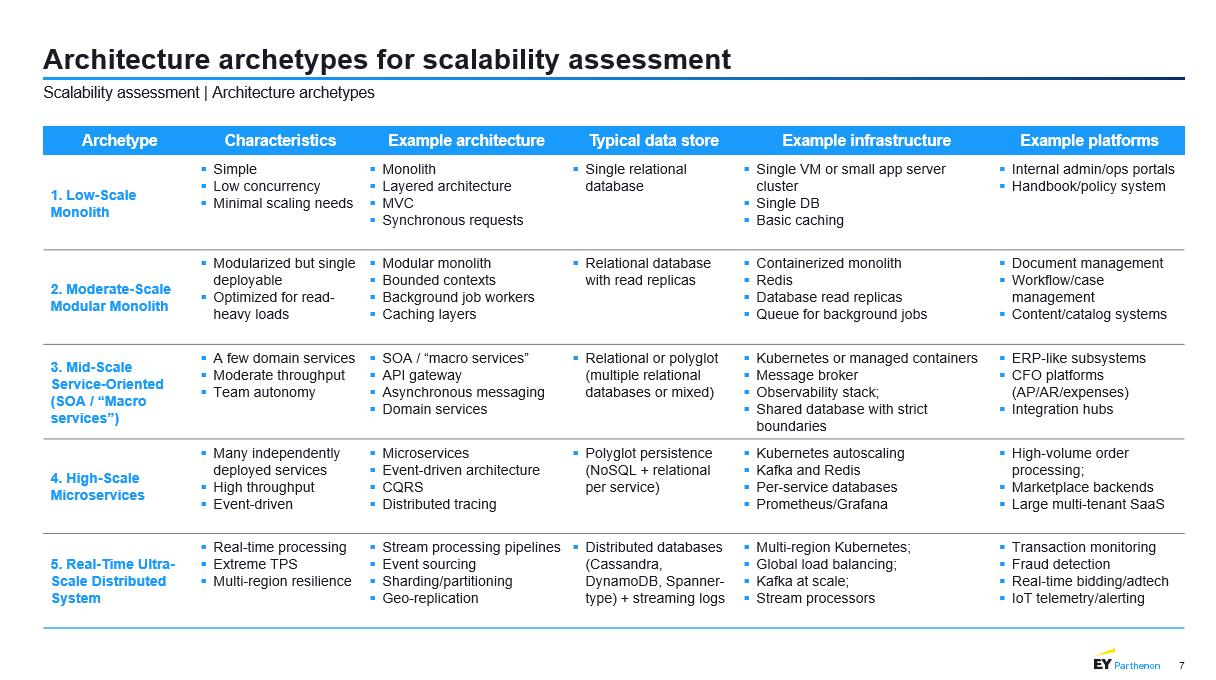
Each tier represents a qualitatively different kind of system:
Tier 1 — Low-Scale Monolith. A single deployable unit, single relational database, synchronous request handling, minimal automation. Ideal for internal admin portals, handbook systems, and any application whose growth is intrinsically bounded.
Tier 2 — Moderate-Scale Modular Monolith. Still one deployable, but internally organised around bounded contexts, read replicas, caching layers, and containerised deployment. Optimised for read-heavy workloads. Typical of document management, workflow/case management, and content platforms.
Tier 3 — Mid-Scale Service-Oriented (SOA). A handful of coarse-grained domain services behind an API gateway, communicating asynchronously via message brokers. Kubernetes or managed orchestration. Teams own services. Typical of ERP subsystems, CFO platforms, and integration hubs.
Tier 4 — High-Scale Microservices. Many independently deployed services, high throughput, event-driven communication, polyglot persistence with per-service databases, CQRS, distributed tracing, and Kubernetes autoscaling. Typical of high-volume order processing, marketplace backends, and large multi-tenant SaaS.
Tier 5 — Real-Time Ultra-Scale Distributed System. Extreme TPS, real-time processing, multi-region resilience, stream processing pipelines, event sourcing, sharding, geo-replicated distributed databases. Typical of transaction monitoring, fraud detection, real-time bidding, and IoT telemetry.
A tier is not a ranking of goodness. It is a description of engineering complexity and operational cost. Running a Tier 5 system costs orders of magnitude more than running a Tier 2 system. The right tier is the lowest tier that comfortably accommodates your expected load and growth.
The six dimensions that define a tier
A system is not a single thing — different parts of its architecture can mature at different rates. CodeDD measures six dimensions independently. Each dimension is scored on a 0-to-100 scale, then mapped to one of the five tiers using band thresholds.
1. Deployment Model. How the system is packaged and released — from manual uploads on a single VM to independently deployable microservices with blue/green and canary rollouts.
2. Data Architecture. Database topology, caching layers, and data distribution. From a single relational DB with local file storage, through read replicas and cache-aside patterns, up to distributed sharded databases with geo-replication.
3. Communication Style. How services and clients talk to each other. From purely synchronous REST, through background workers and async messaging, to Kafka-based event pipelines and stream processing.
4. Infrastructure Maturity. Monitoring, Infrastructure as Code, CI/CD, and operational tooling. From ad-hoc scripts on a single VM to multi-region Kubernetes with global load balancing.
5. Scaling Mechanisms. Horizontal and vertical scaling capabilities, auto-scaling, and workload distribution. From purely vertical scaling, through application-level caching and CDNs, to sharded data stores and stream processing at scale.
6. Operational Maturity. Observability, incident response, feature management, and release practices. From server log files and manual uptime checks to chaos engineering, SLO-based alerting, and multi-region observability.
From score to tier: the banding model
Each dimension has its own set of score bands because the dimensions behave differently at the extremes. For example, Deployment Model Tier 3 sits in the 47-69 band, whereas Communication Style Tier 3 sits in the 43-68 band. The bands were calibrated against real-world architectures so that a score of 55 on any dimension consistently indicates Tier 3 maturity for that specific concern.
The centroid of each band represents the "ideal" score for a system squarely at that tier. Using Deployment Model as an example:
- Tier 1 centroid: 12 (band 0-24)
- Tier 2 centroid: 35 (band 24-47)
- Tier 3 centroid: 58 (band 47-69)
- Tier 4 centroid: 80 (band 69-86)
- Tier 5 centroid: 92 (band 86-101)
A score of 55 lands in the Tier 3 band but below its centroid. The system has reached Tier 3 qualitatively, but has room to mature inside the tier. A score of 58 lands right at the centroid — a textbook Tier 3 deployment model.
Prerequisite gates: why points alone are not enough
One subtle issue with purely score-based tiering is that you can rack up points in "easy" dimensions and skip the hard ones. A system could theoretically accumulate a high Operational Maturity score from logging and monitoring, while still being deployed manually from a developer laptop. That system is not genuinely Tier 3, no matter what the weighted score says.
To prevent this, CodeDD applies prerequisite gates to each tier upgrade. Gates are minimum score thresholds that must be passed on specific dimensions before the overall tier can advance.
- Tier 2 requires minimum scores in Deployment Model and Infrastructure Maturity.
- Tier 3 additionally requires Communication Style.
- Tier 4 additionally requires Data Architecture.
- Tier 5 additionally requires Scaling Mechanisms.
The gate thresholds are deliberately lower than the corresponding tier centroids. A gate is a minimum qualifying bar, not the full performance level. You cannot reach Tier 3 without having at least basic async communication in place, even if every other dimension is spectacular.
This is why the CodeDD dashboard shows two separate progress metrics when you look at an upgrade target:
- Gates passed — how many prerequisite dimensions have crossed their minimum threshold.
- Dimensions at tier score — how many dimensions have reached the full centroid for the target tier.
A system can pass all its gates (unlocking the upgrade path) while still having only, say, 2 of 6 dimensions fully at the tier-centroid level. This is the normal state during a migration. It tells you the direction is right and what remains to be tuned.
Evidence, not opinion
Every dimension score is built up from concrete, detectable evidence in the codebase. For example, Infrastructure Maturity rewards:
- Kubernetes manifests or Helm charts
- Terraform, Pulumi, CloudFormation, or CDK files
- CI/CD configuration (GitHub Actions, GitLab CI, Jenkins, CircleCI)
- Cloud-provider SDKs and configuration (AWS, Azure, GCP)
- Secrets-management integrations (Vault, cloud KMS)
- Auto-scaling configuration (HPA, KEDA)
Each finding carries a strength label:
- Strong — direct, high-confidence evidence (a
Dockerfile, aterraform/directory, adeployment.yaml). - Medium — dependency-level or indirect evidence (a Kubernetes client library in
package.json). - Weak — inferred or pattern-based evidence, or a limiting factor (the absence of containerisation, a monolith-only pattern).
The strength labels feed the UI's split between "positive signals" (contributing to score) and "limiting factors" (capping the score or indicating a tier-1 characteristic).
Penalty caps: preventing false positives
Some architectural patterns are so fundamentally limiting that no combination of other evidence should paper over them. CodeDD applies penalty caps to enforce this. If a critical capability is missing, the dimension score is hard-capped regardless of other positive signals.
Examples:
- No containerisation caps Infrastructure Maturity at 28 points (the top of the Tier 1 band).
- Single-database-only caps Data Architecture similarly.
- No async messaging caps Communication Style.
- No auto-scaling caps Scaling Mechanisms.
- No monitoring caps Operational Maturity.
The cap mechanism makes the scoring model robust: you cannot earn your way to Tier 4 Communication Style on the strength of webhook implementations alone if the system has no message broker.
The Operational Index: a five-pillar composite
While the Architecture Tier answers what kind of system this is, the Operational Index answers how well it is engineered within its class. It is a single 0-to-100 number computed as a weighted composite of five operational pillars:
- Architecture (weight 30%) — cohesion, coupling, and modularity of the component graph.
- Modularity / Decoupling (weight 25%) — whether the code is genuinely modular or is a ball of mud.
- Data Layer (weight 20%) — database interaction efficiency, query patterns, ORM usage.
- Infrastructure (weight 15%) — overlap with the Architecture Tier's Infrastructure Maturity dimension but weighted for operational readiness specifically.
- Performance (weight 10%) — concurrency, load handling, and resource utilisation patterns.
The weights reflect a deliberate choice: the operational pillars that are hardest and most expensive to change post-deployment carry the most weight. Rewriting your entire architecture costs more than adding observability; the score reflects that reality.
The Operational Index result maps to a risk level:
- 75+ — Low risk, strong scalability headroom within the current tier.
- 60-74 — Moderate, with specific bottlenecks worth addressing.
- 45-59 — Notable operational debt; the current tier is not being fully utilised.
- 30-44 — Significant operational debt; scaling events will expose weaknesses.
- Below 30 — High risk; the system is likely to struggle even at the current tier's expected load.
The safe growth factor
The two scores combine into a single forward-looking number — the safe growth factor. This is the multiple by which traffic, users, or throughput can grow before the platform is expected to hit a serious bottleneck. It is computed from the Operational Index and then capped at the ceiling of the current Architecture Tier.
The cap matters. A beautifully-engineered Tier 2 modular monolith might earn a safe growth factor of 3x based on its Operational Index alone — but the Tier 2 ceiling itself is bounded by architectural class. Growth beyond the ceiling requires a tier upgrade, which is a multi-quarter engineering investment, not a configuration change.
Single-repo vs multi-repo platforms
A large share of enterprise platforms are not one repository but many — frontends, backends, data pipelines, shared libraries. CodeDD scores each repository independently and then aggregates into a portfolio view using two techniques:
Portfolio-weighted dimension profile. For each of the six dimensions, the portfolio score is a weighted average across repositories, where the weight is the larger of each repository's component count and lines of code. This prevents a tiny shared-utility library from skewing the portfolio average in either direction, and ensures the heavy-lifting repositories dominate the aggregate — which matches reality, since those are also the repositories that will dominate runtime behaviour.
Cross-repo topology detection. Beyond per-repository scoring, CodeDD builds an organisation-wide component graph that detects cross-repo API calls and shared data dependencies. A portfolio with many tightly-coupled cross-repo dependencies is architecturally different from a portfolio of genuinely independent services, even if every individual repository scores identically. The dashboard surfaces this as the "cross-repo edges" count.
Gate-aware aggregation. The portfolio tier uses the same prerequisite-gate logic as individual repositories. An organisation whose payment service is at Tier 4 but whose authentication service is stuck at Tier 1 does not get a free pass to Tier 4 at the portfolio level — the weakest critical repository pulls the portfolio tier down, because in reality the blast radius of a single Tier 1 authentication outage takes down the entire Tier 4 payment experience.
Turning scores into actions
Scores are only useful if they translate into concrete engineering decisions. Every dimension card in the CodeDD dashboard surfaces a specific recommendation from a pre-authored library of tier-upgrade actions. These recommendations are keyed by (dimension, current tier) and tell engineering teams exactly what to do next. A sample:
- Infrastructure Maturity, Tier 1 → Tier 2: "Containerise the application with Docker and introduce a CI/CD pipeline."
- Infrastructure Maturity, Tier 2 → Tier 3: "Adopt Kubernetes for orchestration and Infrastructure as Code (Terraform)."
- Data Architecture, Tier 2 → Tier 3: "Introduce polyglot persistence: use the best data store per service domain."
- Communication Style, Tier 3 → Tier 4: "Adopt a streaming platform (Kafka) for high-throughput event pipelines."
Each recommendation is also paired with a concrete point gap — how many points the dimension needs to gain to cross the next band, and how many to pass the next prerequisite gate. Engineering leaders can sequence a quarterly roadmap against the gates first (unlocking the tier upgrade) and then the centroids (maturing within the tier).
Why this matters for due diligence
In the M&A and investment context, the Scalability Index gives buyers and boards three things that were previously hard to obtain without weeks of consultant work:
1. A defensible technical classification. Whether a platform is Tier 2 or Tier 4 is a first-order valuation driver. A Tier 4 system can absorb a 10x growth plan; a Tier 2 system will need a rewrite budget. Previously this assessment required a manual code review by senior engineers, typically two to four weeks of work. CodeDD returns it in a few hours with full evidence traceability.
2. A realistic growth projection. The safe growth factor, capped by the Architecture Tier ceiling, gives a concrete number to plug into financial models. It replaces hand-wavy statements ("the platform is highly scalable") with an auditable upper bound.
3. A prioritised remediation roadmap. For acquirers and their integration teams, the tier-upgrade recommendations are a ready-made list of the highest-impact architectural investments, ordered by which ones unlock tier transitions. This shortens post-close integration planning significantly.
Conclusion
The Scalability Index combines two complementary lenses. The Architecture Tier tells you what class of platform you are looking at and therefore what growth ceiling the current design can support. The Operational Index tells you how efficiently the platform is engineered within that class. The six underlying dimensions, the score bands, the prerequisite gates, the penalty caps, and the portfolio-level aggregation together produce a single measurement framework that is both evidence-based and transparent.
Crucially, the framework is prescriptive, not just descriptive. Every score comes with the evidence behind it, the tier band that explains it, and the concrete architectural action needed to improve it. This is what makes it useful for engineering leaders who have to prioritise a quarterly roadmap, and for boards and acquirers who need to understand what they are buying before they buy it.
We thank EY for their input into the original tier taxonomy, whose structure and enterprise-scale examples underpin the five-tier model used throughout the platform.
Frequently Asked Questions (FAQ)
1. What is the difference between the Architecture Tier and the Operational Index?
The Architecture Tier is a 1-to-5 classification of what kind of system the platform is structurally — monolith, modular monolith, SOA, microservices, or distributed. The Operational Index is a 0-to-100 score of how well that system is engineered within its class. The tier tells you the growth ceiling; the Operational Index tells you your headroom inside that ceiling.
2. How is the Architecture Tier calculated?
Six dimensions (Deployment Model, Data Architecture, Communication Style, Infrastructure Maturity, Scaling Mechanisms, Operational Maturity) are each scored 0-100 from concrete evidence in the codebase, then mapped to a tier using per-dimension score bands. An overall tier is computed from the dimension tiers, constrained by prerequisite gates that ensure critical capabilities are actually in place.
3. What are prerequisite gates?
Prerequisite gates are minimum score thresholds on specific dimensions that must be passed before a tier upgrade can register. They prevent a system from racking up points on easy dimensions while skipping the hard ones. For example, you cannot reach Tier 3 without at least a minimum level of asynchronous communication.
4. Why are some evidence items marked as "limiting factors" instead of "positive signals"?
Evidence describing an absent capability ("No containerisation detected", "Monolithic architecture pattern", "Single database category") is a limiting factor for scalability, even when the underlying detection is highly confident. The UI separates positive contributions from limiting factors so that the path to improvement is obvious at a glance.
5. How does the platform handle organisations with many repositories?
CodeDD scores each repository independently and then aggregates to a portfolio profile using weighted averages (weighted by component count and lines of code). It also builds a cross-repository component graph to detect coupling between repositories, which influences the organisation-level tier. The weakest critical repository constrains the portfolio tier through the same gate mechanism applied at the individual-repository level.
6. What is the safe growth factor?
The safe growth factor is the multiple by which traffic, users, or throughput can grow before the platform is expected to hit a serious bottleneck. It is derived from the Operational Index and then capped at the Architecture Tier's growth ceiling. It gives boards and investors a concrete, defensible number for financial modelling.
7. How do I know what to improve first?
Every dimension card surfaces a specific, tier-appropriate recommendation and a point gap to the next prerequisite gate and to the next tier centroid. Prioritise gates first (they unlock the tier upgrade) and centroids second (they mature the system within the tier). The dashboard also shows a cross-dimension gate overview so that engineering leaders can sequence a quarterly roadmap against the actual upgrade path.
8. Did EY develop this framework?
The five-tier archetype taxonomy — tier names, characteristics, example architectures, example platforms — was developed in collaboration with EY. CodeDD implemented the scoring, banding, gate, penalty-cap, and Operational Index layers on top of that taxonomy, along with the evidence-collection and portfolio-aggregation machinery that turns a repository into a tier.